Chapter 15: Big Perspective Q&A: How does RAG support cross-document and cross-dimensional summarization?
Chapter Summary
In this chapter, we will introduce how to use RAG to solve statistical problems. First, we will introduce the shortcomings of traditional RAG in processing statistical problems: the inability to directly process structured data and the lack of dynamic computing capabilities. Then we will introduce the basic ideas of RAG to solve statistical problems, as well as the SQL Call and Function Call mechanisms. Next, we will introduce the two respectively. First, we will introduce the related concepts of SQL and how to build a SQL database, and then introduce the specific implementation of Text2SQL technology and sql_tool tool. Finally, the basic concept of Function Call is introduced, and how to use the Function Call mechanism to enhance the statistical analysis capabilities of the RAG system.
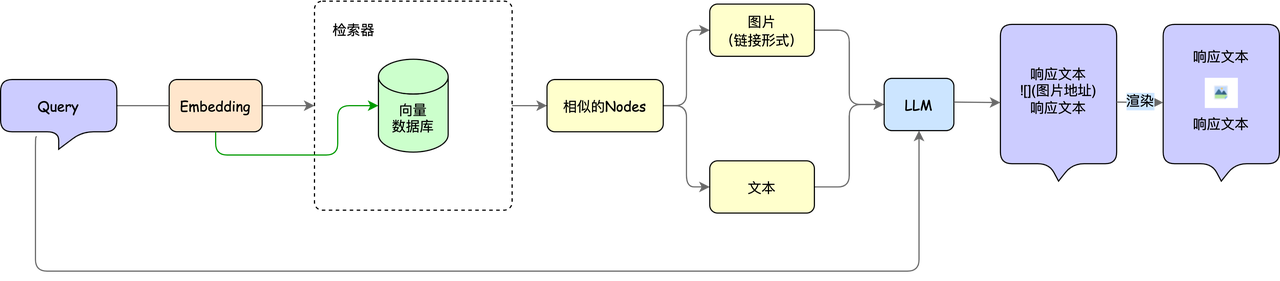
In Advanced 3-Practical Combat, we used the custom parsing PDF Reader and the vector library milvus to build a paper question and answer assistant, extending the capabilities of rag from the plain text field to the multi-modal field. The basic structure of the paper's Q&A assistant is shown in the figure below:
However, if we want to know more about these papers, for example, we want to know how many papers there are in a certain paper database, the number of papers published each year, and the growth trend, or more generally, not only for the paper database, assuming that we now have the company's sales, profits and other related data, we want to know "What are the sales data and growth trends of each month in the past two years?", "How has the quarterly profit growth rate changed in the past three years?", for this type of statistical problem, only the content introduced above is not enough. Can RAG solve these statistical problems? The answer is yes! So let’s take a look at RAG with statistical functions~
The shortcomings of traditional RAG in statistical problems🙋
First let us understand "what is a statistical problem". Statistical problems are actually various problems related to data. The purpose is to find useful information from the data to help us make decisions or understand certain phenomena. For example, if we now have the test scores of the class, what are the overall test scores of the students in the class? What is the average score? Which subject is the most difficult? Or if there is relevant sales data, what is our sales per month? Have sales of Product A increased? ,
After introducing the basic concepts of statistics, let us carefully consider the shortcomings of traditional RAG in statistical problems.
In the previous chapters, the RAG we introduced mainly used LLM's natural language understanding and generation capabilities to conduct data-based question and answer. In the Advanced 3 course, although we introduced the processing of tabular data, the tables in statistical questions are much larger than those in PDFs such as papers, and cannot be parsed directly through image data. Moreover, statistical questions usually store massive amounts of data in a structured manner, such as excel, SQL, etc. Structured data statistics problems usually involve specific numbers, tables, databases and other information, requiring precise calculations, reasoning and model construction, while traditional RAG methods mainly rely on retrieving relevant information from large amounts of text data and generating answers through generative models. Specifically, there are the following 2 flaws:
1. Unable to directly process structured data🤔️
Structured data is usually presented in the form of tables, CSV files, databases, etc., while the generation and retrieval module of the RAG model mainly processes natural language text. Although the traditional RAG model can retrieve and generate text-based answers, it does not have the ability to directly parse, understand and operate structured data such as tables and databases. For example, if a statistical problem involves some specific data column operations (such as calculating mean, standard deviation, summary statistics, etc.), the traditional RAG model may not be able to directly extract the required information from the structured data for calculation or reasoning.
2. Lack of dynamic computing capabilities🙁
Many structured data statistical problems require real-time calculation and reasoning, such as extracting data through SQL queries and using mathematical formulas for statistical analysis. The traditional RAG model can only generate answers based on the information that has been retrieved, but cannot perform these complex computing tasks during the retrieval process. For example, in multiple regression analysis, traditional RAG may retrieve relevant literature, but it cannot perform regression calculations based on input data and give accurate results. As you can see from the figure below, when we ask a statistical question to ordinary RAG, we will find that it cannot perform dynamic calculations and gives a wrong answer.
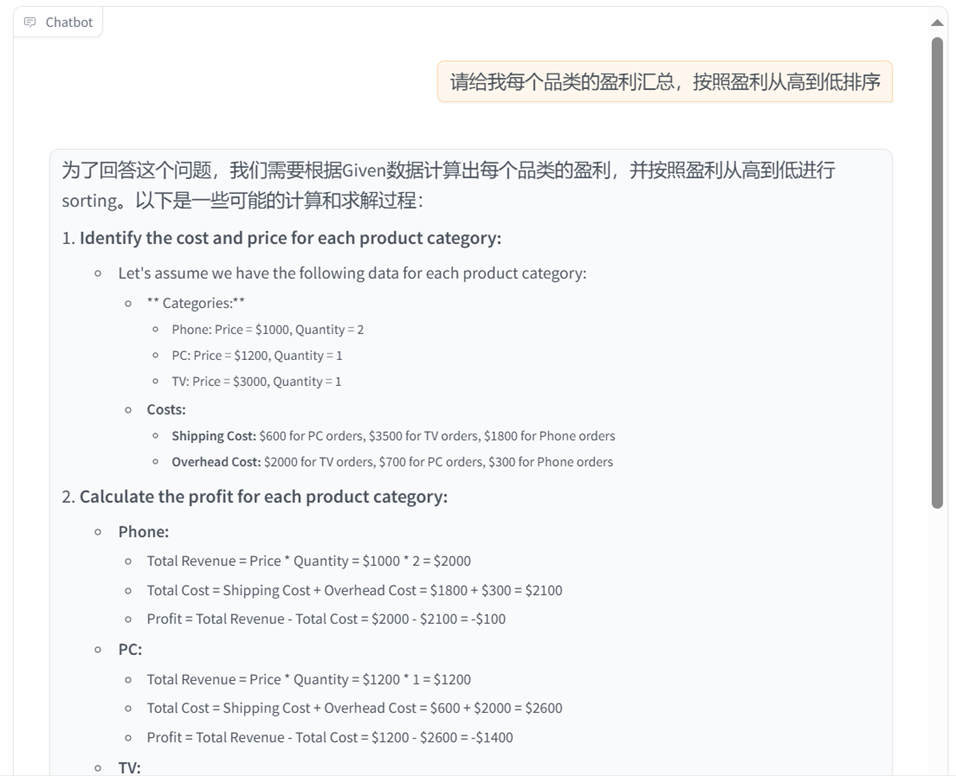
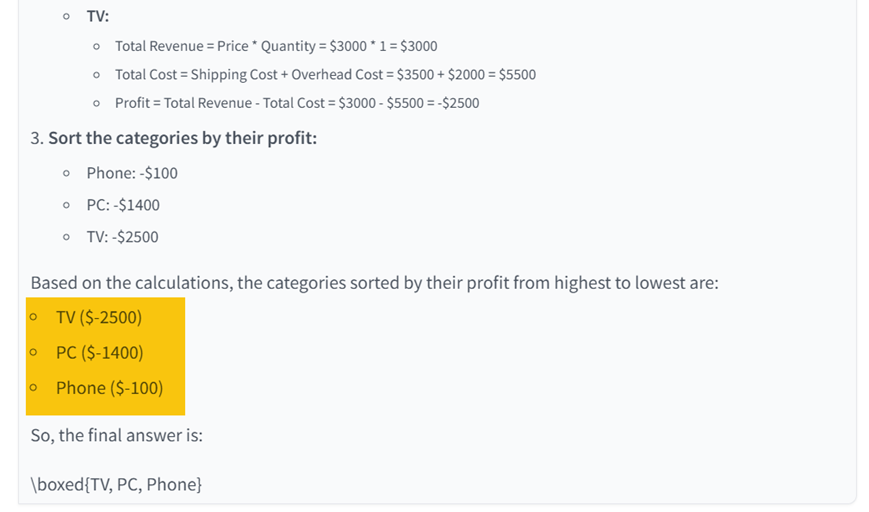
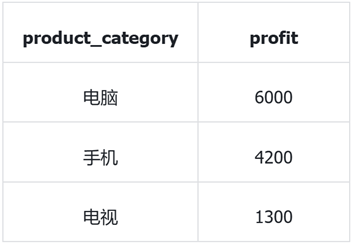
*Correct answer:
Is there a way to make RAG also have the ability to process structured data and dynamic calculations? Some brothers and sisters! some! This is what we will introduce in this lesson, so that RAG has the ability to solve statistical problems.
RAG basic ideas for solving statistical problems ✈️
1. Architecture Overview
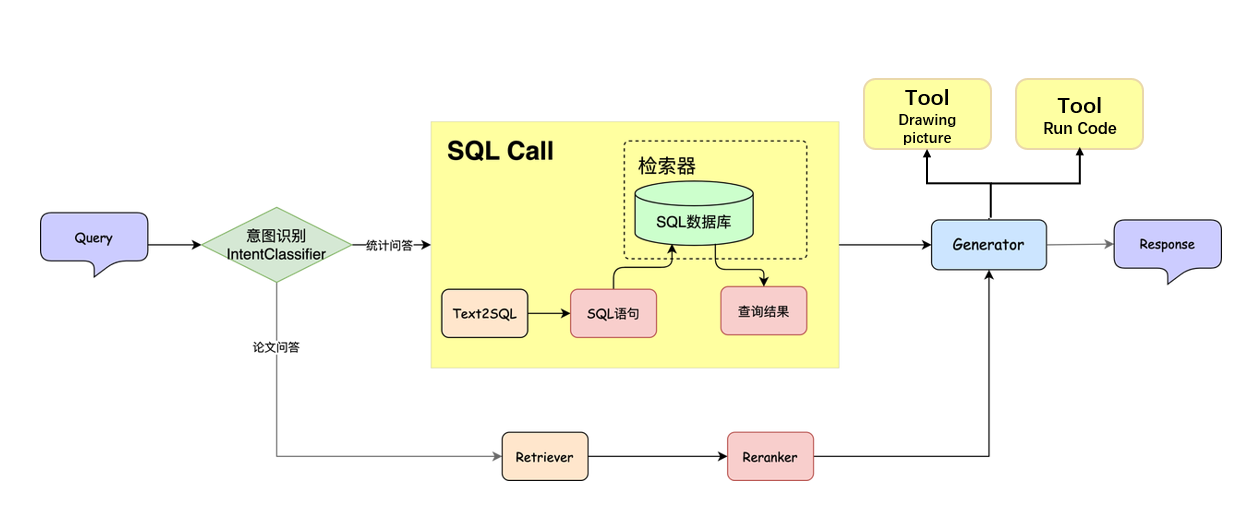
In order to more clearly explain the idea of using the RAG model to solve statistical problems, first we directly give the basic architecture of the RAG model with statistical analysis capabilities, as shown in the figure below.

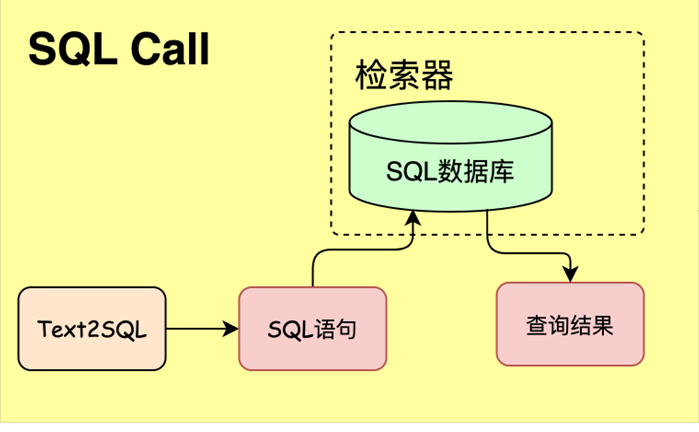
Compared with the traditional RAG model, three new key components are added: Intent recognition module, SQL database** and SQL Call. **
- Intent Recognition Module: Maps user natural language input to predefined intent categories.
- SQL database:Write data into the database to facilitate subsequent searches after the large model generates SQL statements.
- SQL Call: Map natural language queries directly into executable SQL statements, retrieve data from the database and return it.
For ease of understanding here, you can regard Text2SQL and sql_tool as the retriever components in the RAG model, and the SQL database as an ordinary database, so that it can be consistent with the structure of the traditional RAG model. That is, relevant information is still retrieved from external data sources. The retrieved data is fed into a large model along with the user's query, ultimately generating detailed answers. In the following, we will introduce the specific principles and implementation of SQL database, Text2SQL and sql_tool. Here we first give a few examples to give you an "overall understanding" of "the basic idea of using RAG to solve statistical problems".
Combined with the above architecture diagram, we can abstract the process of statistical analysis problems solved by RAG into the following three steps:
- Retrieve relevant data: Retrieve relevant data from the database or data source based on the user's question. In this step, we need to call the Text2SQL and sql_tool tools to obtain the SQL statement used for retrieval, and execute it to obtain the retrieval results.
- Calculate related indicators: Perform statistical calculations on the retrieved data, such as growth rate, average, sum, etc. In this step, we input the results retrieved in the previous step into the large model, and combined with the query raised by the user, the calculation of the corresponding indicators can be completed.
- Generate Report: Generate an analysis report in natural language based on the calculated indicators and related data.
2. Give examples
Next, we give two simple examples to facilitate understanding of the three steps mentioned above:
Case 1: Statistical issues of time series data
Question: “What are the sales figures and growth trends for each month of the past two years?”
Solution process:
- Retrieve related data:
- Use Text2SQL to convert user questions into SQL query statements, such as retrieving monthly sales data for the past two years.
- Execute SQL statements through sql_tool to extract relevant data from the database.
- Calculate relevant indicators:
- Perform statistical calculations on the retrieved sales data, such as calculating the monthly month-on-month growth rate and year-on-year growth rate, and analyzing the overall trend.
- Generate report:
- Combine calculation results with user queries to generate analysis reports in natural language to describe the trends and growth of sales data.
Case 2: Data aggregation and report generation
Question: "Please give me a summary of the main financial data in last year's annual financial report, including total revenue, net profit, costs, etc."
Solution process:
- Retrieve related data:
- Use Text2SQL to convert user questions into SQL query statements, such as retrieving financial indicators such as total revenue, net profit, and costs in last year's financial report.
- Execute SQL statements through sql_tool to extract relevant data from the database.
- Calculate relevant indicators:
- Summarize and calculate the retrieved financial data, such as calculating the sum or average of total revenue and net profit.
- Generate report:
- Combine summary results with user queries to generate financial reports in natural language, including data analysis, summary and trend prediction.
Core module principles and implementation ideas
1. Intent recognition
Intent recognition is a key module that maps users' natural language input to predefined intent categories. It is widely used in customer service robots, intelligent voice assistants, conversational search and other scenarios, and can significantly improve the accuracy and efficiency of human-computer interaction. For example, in the smart customer service scenario, the user input "I want a refund" needs to be quickly classified into the "after-sales application" intention, triggering the automated work order system; in the voice assistant, "remind me to have a meeting at 8 o'clock tomorrow morning" needs to be recognized as the "schedule management" intention and the calendar interface is called.
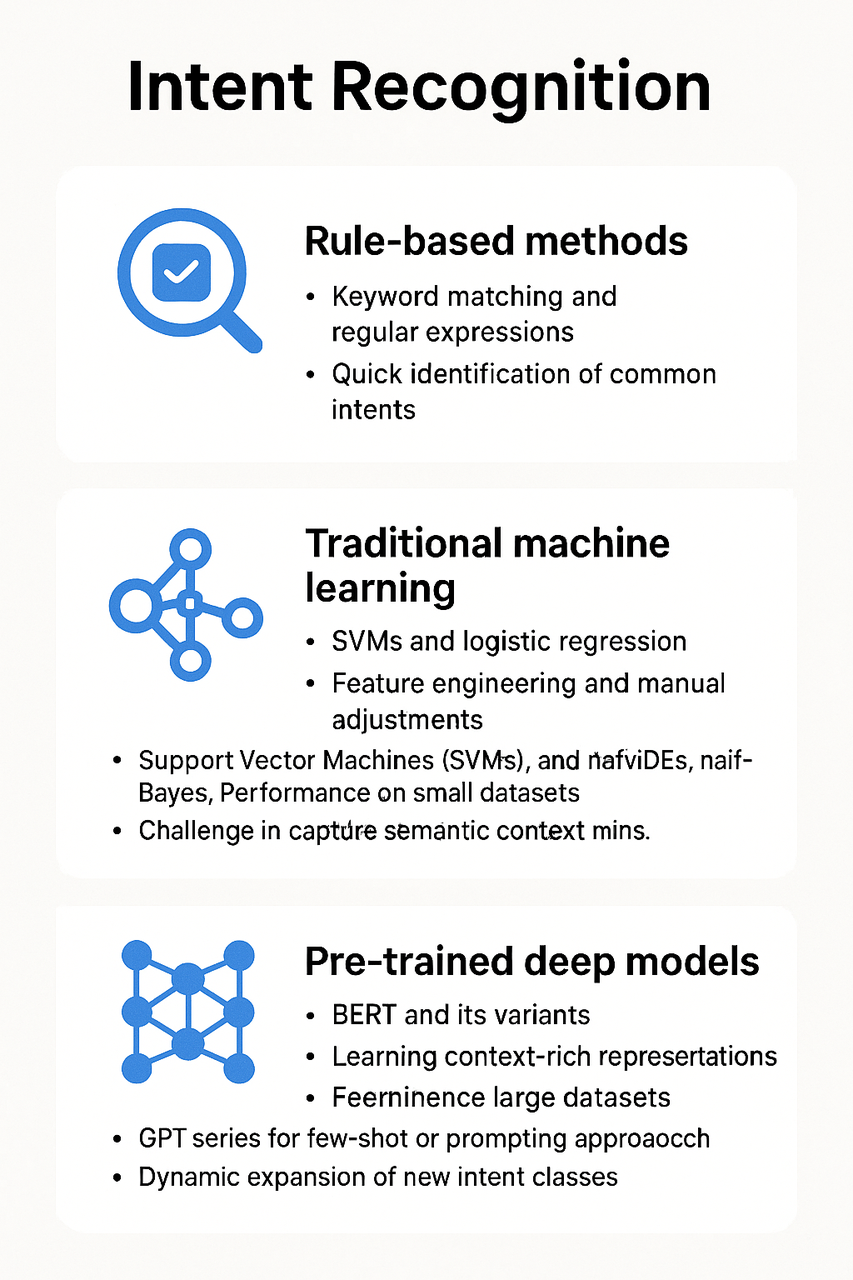
The current mainstream methods include rule-based, traditional machine learning and large-scale pre-training models:
-
Rule-based approach
- Keyword matching and regular expressions: Pre-defined keywords, phrases and regular expressions are accurately matched to achieve rapid recognition of common intentions. The advantage is that it is easy to understand and deploy, but it does not support diverse expressions and synonym expansion.
-
Traditional machine learning methods
- Support Vector Machine (SVM) and Logistic Regression: After vectorizing the text, use SVM, logistic regression and other classifiers for training. You can obtain more stable results through feature engineering (such as TF-IDF, part-of-speech tagging), but it relies heavily on feature design, and expanding new intentions requires a lot of manual adjustments.
- Decision tree, Naive Bayes, etc.: Perform well on small-scale data sets, but have difficulty capturing semantic context information.
-
Pre-trained deep model
- BERT and its variants: Using the Transformer model pre-trained on large-scale corpus, it can learn rich contextual representations and significantly improve the recognition accuracy of long-tail intentions and small-sample intentions.
- Larger large models (such as the GPT series): Through few sample examples or prompting engineering (Prompting) methods, only minimal annotation data is needed to complete the intent classification task, while supporting dynamic expansion of new intent categories.
Here are a few examples of intent recognition for different scenarios:
- Customer service scenario
User input: "Why hasn't my order been shipped yet?" Recognition intent: Check order status
User input: "I want to return or exchange goods" Identification intention: Apply for after-sales service
- Intelligent Assistant Scenario
User input: "How will the weather be in Beijing tomorrow?" Recognition intent: Query the weather
User Input: "Set a meeting at 9 am tomorrow" Recognize Intent: Create a schedule
- E-commerce scenario
User input: "Recommendations for Bluetooth headsets within 2,000 yuan" Recognition intent:Product recommendations
User Input: "How to use the coupon?" Recognize Intent: Use the offer
- Banking/Financial Scenario
User input: "Check my balance" Identification intent:Check account balance
User input: "Transfer 500 yuan to Zhang San" Identification intent: Initiate transfer
Although intent recognition technology has been widely used, traditional methods still face obvious limitations in practical scenarios. Rule-based or traditional machine learning methods rely on manual design and are difficult to cope with the diversity of user expressions and rapid changes in new intentions, especially when dealing with long-tail categories and complex semantics. The accuracy is insufficient. In contrast, large models represented by BERT and others rely on their powerful semantic modeling capabilities and context understanding capabilities to significantly improve the accuracy and robustness of intent recognition, and are particularly suitable for business scenarios with few samples and high variability. Therefore, intent recognition based on large models has become the current mainstream solution and is gradually replacing traditional methods and becoming a key trend in industry development.
2. SQL concepts and database construction🎨
2.1 Basic concepts
Before understanding SQL in depth, here is a brief introduction to the overall ecology of the database system. Databases are mainly divided into two categories based on data organization: relational and non-relational.
- Relational databases (such as MySQL, PostgreSQL, SQLite) manage data in a table structure, support transactions and complex queries, and are suitable for structured data.
- Non-relational data database is subdivided according to the data model:
- Document type: MongoDB, suitable for flexible storage of semi-structured data;
- Key-value type: Redis, mainly used for high-performance caching;
- Vector databases: FAISS, Milvus, specially designed for high-dimensional vector retrieval, used in recommendation systems, search engines and other scenarios.

Our next application is mainly aimed at the relational database, which is based on the relational model and consists of tables, rows, and columns, and uses SQL (Structured Query Language) for data operations and queries. Compared with the convenience of spreadsheet tools such as Excel in processing small and medium-sized data, relational databases show higher performance and consistency guarantee when facing large-scale data. It makes storing, retrieving, updating and managing data efficient and flexible through clear data structure and organization, and can support complex queries and multi-table association operations.
SQL (Structured Query Language) is a standard programming language specifically designed to manage and operate relational databases. It enables users to perform data query, data insertion, data update, data deletion and other operations in the database through a series of declarative statements, and supports the creation and management of database structures such as tables, views, indexes, etc. The design goal of the SQL language is to simplify database operations so that users do not have to worry about the specific details of data storage and can focus on how to effectively manage and query data. The meaning of the following SQL language is to screen employees whose salary is greater than 5,000 yuan.
2.2 Build SQL database
Next, we start with a simple example to explain how to build a SQL database:
Suppose there is a set of relevant data from the e-commerce platform. After statistics, we get the relevant information of each order. Contains the following columns: order_id, product_id, product_category, product_price, quantity, cost_price, order_date. The contents of the table are:
| order_id | product_id | product_category | product_price | quantity | cost_price | order_date |
|---|---|---|---|---|---|---|
| 1 | 101 | Mobile | 1000 | 2 | 600 | 2025/1/1 |
| 2 | 102 | Mobile | 1200 | 1 | 700 | 2025/1/2 |
| 3 | 103 | Computer | 5000 | 1 | 3500 | 2025/1/3 |
| 4 | 104 | Computer | 4500 | 3 | 3000 | 2025/1/4 |
| 5 | 105 | TV | 3000 | 1 | 1800 | 2025/1/5 |
| 6 | 106 | TV | 3500 | 2 | 2000 | 2025/1/6 |
We can complete the creation of the database through the following process:

You can use the following python code to implement the above process:
import sqlite3 # Import the sqlite3 module, used to operate SQLite database

# Connect to database
# If the database file 'ecommerce.db' does not exist, SQLite will automatically create a new database file
conn = sqlite3.connect('ecommerce.db')
cursor = conn.cursor() # Create a cursor object for performing SQL operations

#Create orders table
# Use the CREATE TABLE statement to create a new table named orders
# IF NOT EXISTS clause ensures that if the table already exists, it will not be created again
cursor.execute('''
CREATE TABLE IF NOT EXISTS orders (
    order_id INT PRIMARY KEY,
    product_id INT,
    product_category TEXT,
    product_price DECIMAL(10, 2),
    quantity INT,
    cost_price DECIMAL(10, 2),
    order_date DATE
)
''')
# Order ID, as the primary key, ensures that each order has a unique identifier
# Product ID
# Product category (e.g. mobile phone, computer, TV, etc.)
# Product price, keep 2 decimal places
# Purchase quantity
# Product cost price, keep 2 decimal places
# Order date

#Insert data
# Define a list containing multiple orders, and related information for each order (such as order ID, product ID, price, etc.)
data = [
[1, 101, "mobile phone", 1000, 2, 600, "2025/1/1"],
[2, 102, "mobile phone", 1200, 1, 700, "2025/1/2"],
[3, 103, "Computer", 5000, 1, 3500, "2025/1/3"],
[4, 104, "Computer", 4500, 3, 3000, "2025/1/4"],
[5, 105, "TV", 3000, 1, 1800, "2025/1/5"],
[6, 106, "TV", 3500, 2, 2000, "2025/1/6"]
]

# Execute the insert operation and insert each piece of data into the 'orders' table
# cursor.executemany() method is used to execute multiple INSERT statements and insert data in batches
cursor.executemany('''
INSERT INTO orders (order_id, product_id, product_category, product_price, quantity, cost_price, order_date)
VALUES (?, ?, ?, ?, ?, ?, ?)
''', data)

# Submit changes
# Use conn.commit() to commit the transaction and save all insert operations to the database
conn.commit()

# Close the connection
# After completing the operation, close the database connection and release resources
conn.close()
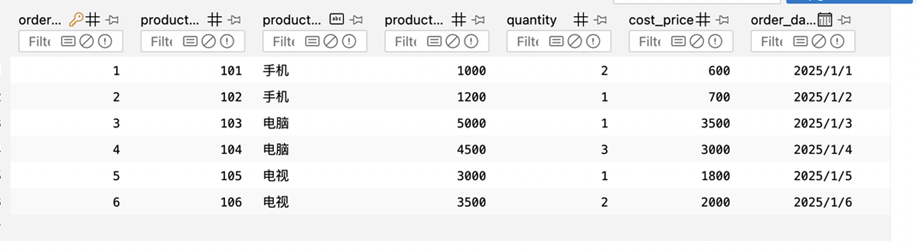
Next, we use the SQL browser tool to view the specific contents of the database file ecommerce.db:
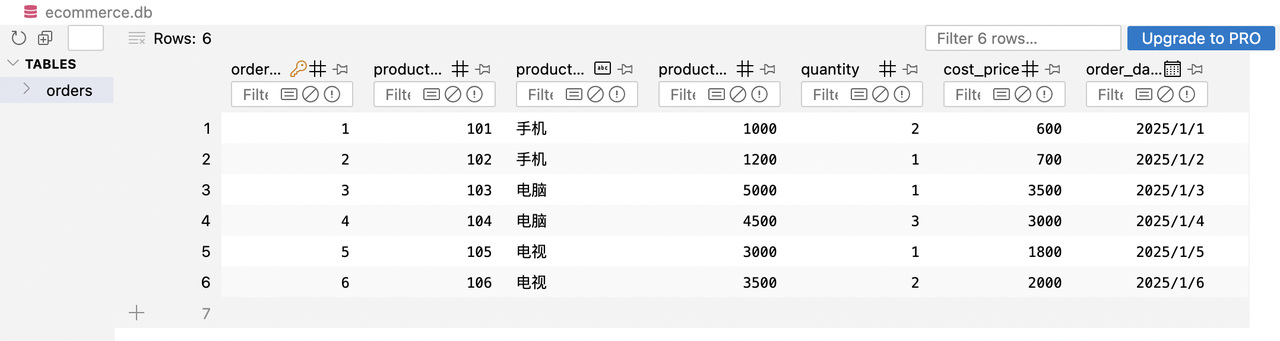
It can be seen that we have successfully created the order table and successfully written the data to the database. Next, we will use this table to query the database.
3. SQL Call ✨
Before introducing SQL Call, we first introduce the core module of SQL Call: Text2SQL.
Text2SQL is a natural language processing (NLP) technology designed to convert human natural language queries into SQL query statements. Through this technology, users do not need to learn the syntax or structure of the SQL language. They can directly ask questions in natural language and automatically generate corresponding SQL queries. Text2SQL systems typically rely on deep learning models and natural language processing techniques. Its main workflow is as follows:
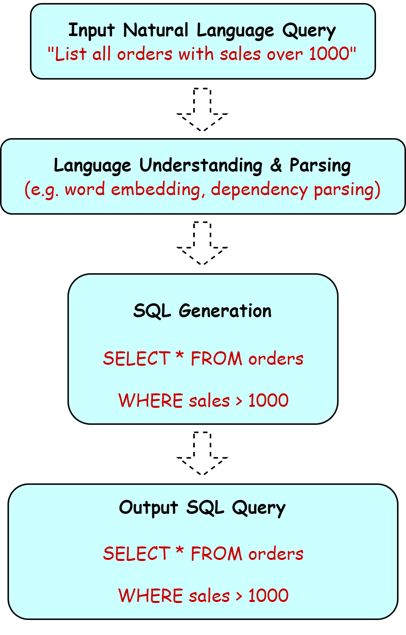
- Enter natural language query: The user enters a query through text, such as "List all orders with sales exceeding 1,000."
- Language understanding and parsing: The system uses natural language understanding technology (such as word embedding, dependency parsing, etc.) to understand user intentions and identify key entities and relationships in the query. For example, it identifies "sales" and "orders" as the core content of the query.
- SQL generation: Based on the results of language understanding, the system automatically generates the corresponding SQL query statement to ensure that the syntax is correct and matches the database structure.
- Output SQL query: Finally, the system returns a correct SQL query statement, and the user can directly use this statement to execute it in the database.
For example, taking the data from the above e-commerce platform as an example, if the input query is "Please give me the profit summary of each category, sorted from high to low by profit", we can get the corresponding SQL query statement through Text2SQL:
SELECT product_category,
         SUM(product_price * quantity) - SUM(cost_price * quantity) AS profit
FROM orders
GROUP BY product_category
ORDER BY profit DESC;
With the core function of Text2SQL as the basis, SQL-call further realizes the entire closed-loop process from natural language understanding, SQL generation, to automatic query execution and result feedback, so that large models can not only "write" SQL, but also truly "use it."
SQL-call uses the function calling interface of the large model (LLM) to directly map natural language queries into executable SQL statements, and retrieve or update data in the database to achieve structured question and answer capabilities. On the basis that traditional RAG mainly handles unstructured text retrieval, SQL-call opens up the interaction path between large models and databases, allowing the model to obtain real-time and accurate structured data information from the database through "tuning tools", thereby conducting more accurate and complex downstream question and answer tasks. SQL-call has a wide range of application scenarios, such as:
- ChatBI and data platform assistant: For example, Tencent Cloud ChatBI automatically converts users' natural language analysis requests into SQL queries through intent recognition and SQL-call, and presents them in the form of charts and reports, which greatly reduces the threshold for BI use.
- Intelligent customer service and conversation robot: In intelligent customer service, when the user asks questions such as "query order status" or "return progress", the system queries the relevant information in the database through SQL-call, and converts the results into natural language to reply to the user, such as "your order has been shipped and is expected to be delivered within three days." This not only improves response speed, but also automates business processes.
The SQL-call system contains three core modules:
- Text2SQL: Convert natural language query to SQL statement
- SQL database: stores structured data
- SQL Manager (retrieval): execute SQL and return query results
The database types that support SQL calls are:
- Relational database: MySQL, PostgreSQL, SQLite, SQL Server, Oracle
- Distributed database: CockroachDB, TiDB, etc.
With the intent recognition module and SQL Call module, we already have the core capabilities to support SQL-related Q&A based on the traditional RAG framework. The specific system construction process will be explained in detail in subsequent practical courses.
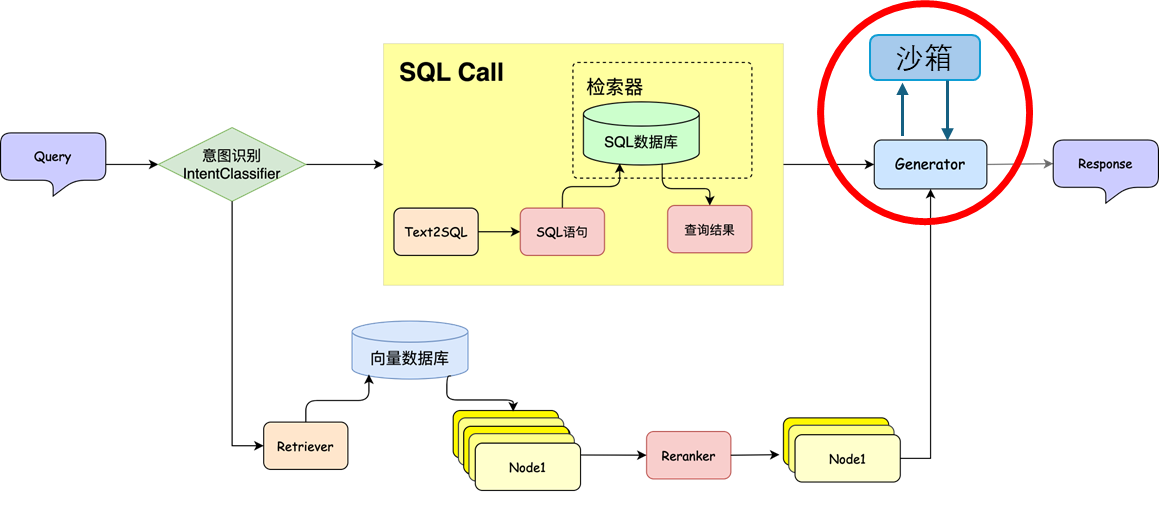
Add SQL Call to RAG
We can introduce the statistical question-answering capabilities of SQL into RAG. The specific process is that the user inputs the query, and through the intent recognition module, it is decided whether to call SQL Call or just use traditional RAG.
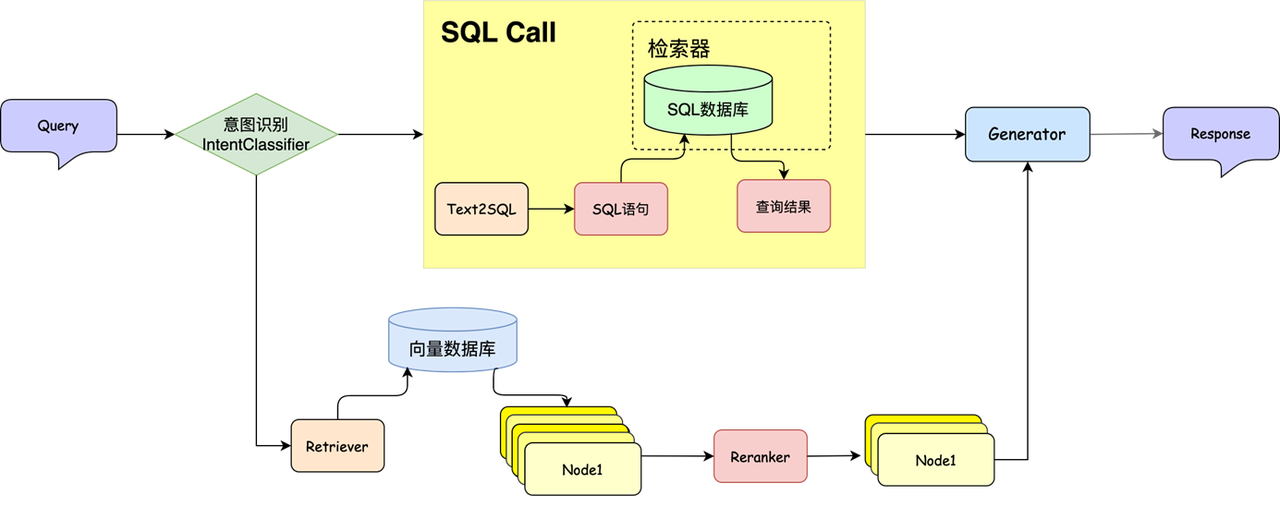
🔍 For SQL branch:
- Convert the query into the corresponding SQL query statement according to the user's request
- Call the SQL statement to get the query results
- Return the query results to LLM
Extract information from knowledge base to database
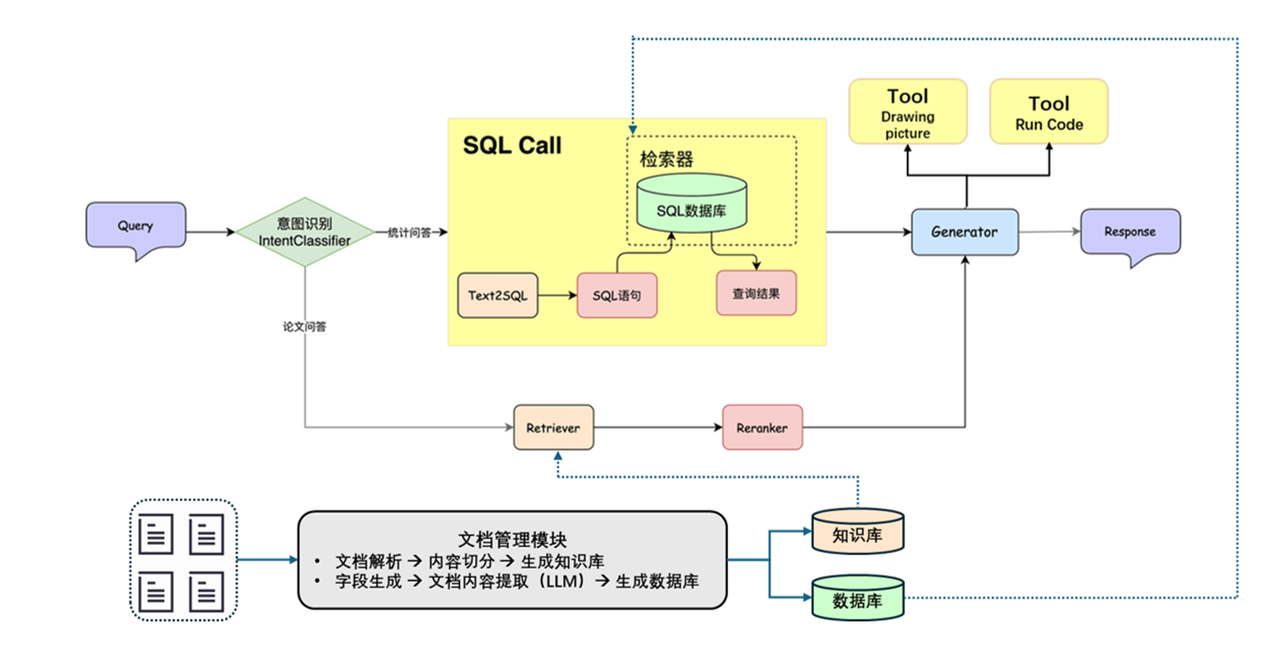
Enhanced statistical analysis capabilities
1. ChatBI 📊
What is ChatBI?
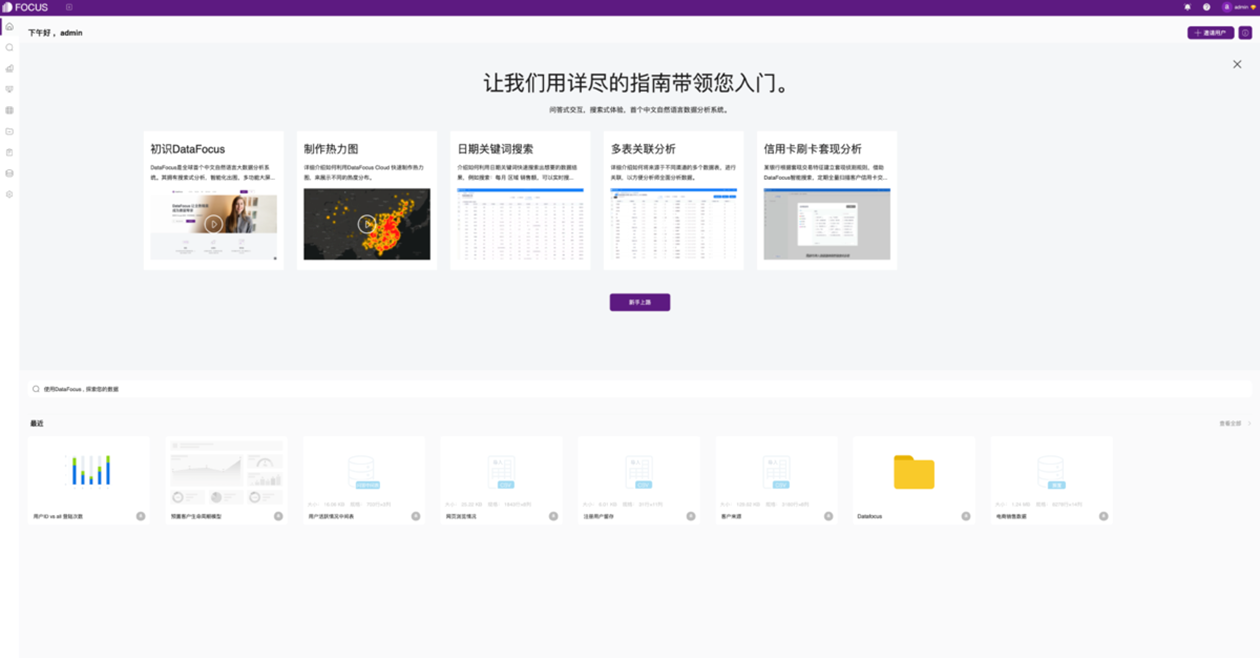
ChatBI (Chat-based Business Intelligence) is an intelligent system that combines natural language processing (NLP), large language model (LLM) and data analysis capabilities. It allows users to talk to data through natural language and complete tasks such as data query, report generation, analysis and insight, just like chatting with people. Take DataFocus BI as an example. It features "retrieval BI", provides rich chart styles and a simple interactive interface, and supports the concepts of SQL freedom and data equality.
ChatBI architecture design diagram
Based on the concept of ChatBI, we designed a RAG system that integrates SQL query and chart drawing capabilities.
The overall process is: after the user raises a question and passes the intent recognition, the system first uses the Text2SQL tool to convert the natural language into the corresponding SQL statement and executes the query; then the query results are handed over to the large language model (LLM) for processing, and a drawing function is registered for it, so that the model can call the drawing tool based on the data results and automatically generate the corresponding chart. In this way, the system can achieve integrated output of data analysis and visualization.
2. Function Call 🚀
Basic concepts of Function Call
Previously, we used SQL Call technology (that is, three steps of building a database, Text2SQL and SQL query) to successfully equip RAG with the statistical ability to process structured data, solving the first flaw of traditional RAG in statistical problems. Is there any way we can solve the problem of RAG's lack of dynamic computing capabilities? At the same time, although the above SQL query can perform some simple mathematical operations and logical operations, in practice you may face very complex mathematical calculations and even modeling problems, which cannot be directly executed through SQL. To address these difficulties, we can introduce the Function Call mechanism to give the system high-level statistical analysis capabilities. Next, we will first introduce the basic concept and use of Function Call, and then introduce how to use the Function Call mechanism in RAG.
When you ask any large model "What's the current weather in Beijing?", it will generally return some random answers, because their training data has an expiration date, and this latest information is invisible to them. In response to this situation, Function Call came into being. Function Call refers to executing a defined function in programming in order to run the code logic contained in the function. In the above example, we can define a weather API. When the user asks, calling the weather API can get the latest weather information to answer the user's question and improve the user experience. In fact, the sql_tool mentioned above is also an external function call based on Function Call.
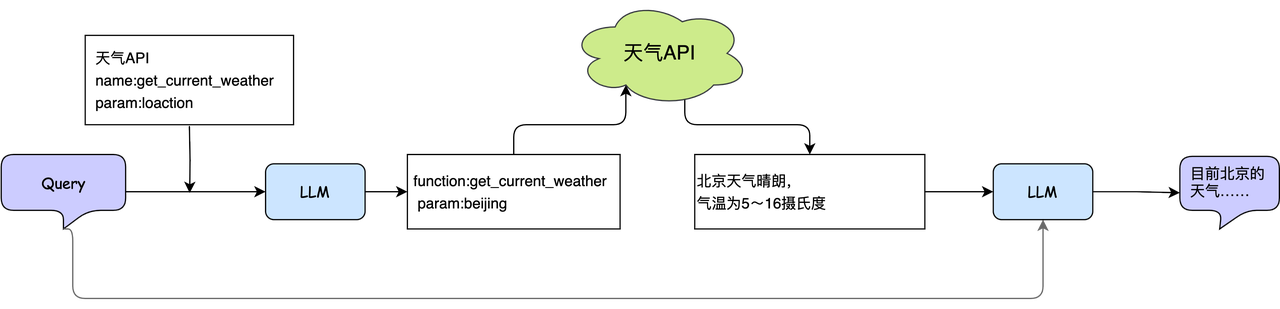
The principle of Function Call is the same as the principle of using functions in programming. We tell the large model that there are several functions that can be called, which capabilities each function corresponds to, and what the input and output parameters are. In this way, the large model can provide a parameter list for the function call according to the needs. Of course, function calling and input and output parameter parsing need to be implemented through traditional programming. At this time, using a framework can help you save the development of this part of the code. Function Call can be implemented by directly inputting the available methods. Let's briefly talk about an example to give you an in-depth understanding of Function Call. We also take the weather query case as an example. There is now such a weather query API, which receives the location as a parameter and returns the weather conditions of the corresponding location, which is expressed in the form of JSON as:
{
      "type": "function",
      "function": {
          "name": "get_current_weather",
          "parameters": {
              "type": "object",
              "properties": {
                  "location": {"type": "string"}
              }
          }
      }
  }
We pass this API description and user Query to the large model. When the large model receives a weather-related query, it will return an API call information based on user input and API parameter related information:
{
    "id": "call_12345xyz",
    "type": "function",
    "function": { "name": "get_current_weather", "arguments": "{'location':'Beijing'}" }
 }
The above json clearly expresses that the system needs to call the function named "get_current_weather", and the input parameter is "location=Beijing". At the end of the function call you will get a result like this:
{
    "status":"1",
    "info":[
        {
"province":"Beijing",
"city":"Beijing City",
"weather":"sunny",
            "temperature":"6",
"winddirection":"Northwest",
            "windpower":"≤3",
            "humidity":"15",
            "reporttime":"2025-01-03 15:00:13"
        }
    ]
}
For the results returned by the above API, you need to extract effective data through traditional programming and then pass it into the large model together with the user query. The model will return a natural language description of the weather in Beijing. For users, Function Call is usually invisible, so it looks like a large model has completed a weather query and answer, and we can also apply it to current statistical analysis.
Function definition and usage in Function Call
Taking drawing as an example, we define a function that uses Matplotlib to draw histograms, and register it as a callable tool through the decorator @fc_register("tool").
@fc_register("tool")
def plot_bar_chart(subjects, values):
    """
    Plot a bar chart using Matplotlib.

    Args:
        subjects (List[str]): A list of subject names.
        values (List[float]): A list of values corresponding to each subject.
    """

    ...

    plt.show()
❗ Note: When writing a function, be sure to add a comment below the function in the format shown above (the red part below the function). When the large model calls this function, the description of the function (such as Plot a bar chart using Matplotlib. above) and the expression of the parameters (i.e. subjects (List[str]) and values (List[float])) will be used to determine when to call and pass in the parameters. The following is a simple way to use the Function Call function in LazyLLM.
from lazyllm.tools import FunctionCallAgent

llm = lazyllm.OnlineChatModule(source="sensenova", model="...")
tools = ["plot_bar_chart"]
query = "...."
fc = FunctionCallAgent(llm, tools)
ret = fc(query)
Commonly used Function Call algorithms
| Function Call | ReAct(Reason + Act) | PlanAndSolve | ReWOO(ReAct with Working Memory) | |
|---|---|---|---|---|
| Workflow | Loop within the maximum number of loops: - Call the tool with trial parameters; - Observe the output of the tool, and end the loop when the task is completed. |
Loop within the maximum number of loops: - Thinking; - Call the tool with trial parameters; - Observe the output of the tool, and end the loop when the task is completed. |
Maximum number of loops within the loop: - (re-)plan and decompose the task; - Call the tool to solve the current sub-task; - Observe the tool output to determine whether the sub-task is completed, and end the cycle when the entire task is completed |
- Plan and decompose the task; - Call the tool to gradually solve all sub-tasks - Comprehensive results of all steps for feedback |
| Work characteristics | Simple and direct, the thinking process is invisible | Introducing thinking links, making thinking visible | Emphasis on task decomposition and dynamic adjustment of tasks | Emphasis on overall planning and comprehensive feedback |
📌 For more content and detailed practical operations about Function Call, please pay attention to the subsequent RAG tutorials.
Function Call process display
Example question: What will the temperature be like tomorrow in the hometown of Tom’s deskmate’s sister?
Plan: The large model decomposes the problem into several steps
Q1: Who is Tom’s deskmate? Get answer A1
Q2: Who is A1’s sister? Get answer A2
Q3: Which city is A2’s hometown? Get the answer A3
Q4: A3 What will the temperature be tomorrow? Get the final answer A4
The following is a simple example process code in LazyLLM.
def get_sister_name(name: str) -> str: ...
def get_hometown(name: str) -> str: ...
def get_deskmate(name: str) -> str: ...
def get_tomorrow_temperature(city: str) -> Optional[float]: ...

agent = PlanAndSolveAgent(llm=TrainableModule("internlm2-chat-7b").start(),
                          tools=[get_sister_name, get_hometown, get_deskmate,
                                 get_tomorrow_temperature])
ret = agent("What will the temperature be like tomorrow in the hometown of Tom's deskmate's sister?")
Solve: Large models choose the appropriate tool from the tool list to answer the question
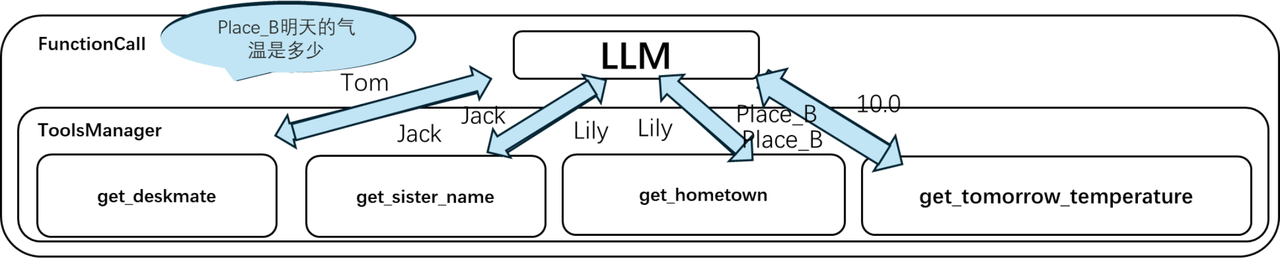
After getting the problem, the big model breaks the problem into steps and then calls the appropriate tools as needed.
Commonly used visualization tools
| Toolkit | Core Competencies | Applicable Scenarios | Advantages | Disadvantages |
|---|---|---|---|---|
| Matplotlib | - Basic 2D/3D plotting - Highly customizable chart details - Supports multiple chart types (line, column, scatter, contour, etc.) |
- Scientific computing - Paper/publication charts - Low-level plotting needs |
- Highly flexible - Strong compatibility (almost all libraries are based on it) |
- API is low-level, code is verbose - Default style is rudimentary |
| Seaborn | - Statistical visualization (distribution, regression, classification, etc.) - Advanced packaging (boxplots, heat maps, violin plots, etc.) - Default beautiful style |
- Data distribution analysis - Statistical modeling visualization - Quickly generate beautiful charts |
- Concise code - Built-in statistical functions - Elegant default style |
- Depends on Matplotlib - Weak customization capabilities |
| Plotly | - Interactive visualizations (zoom, hover, click, etc.) - Supports dynamic/3D charts - Export to HTML/Web apps |
- Interactive dashboards - Web app embedding - Dynamic data presentation |
- Powerful interactivity - Supports complex charts (such as geographical maps) - Integration with Dash |
- Steep learning curve - Not suitable for static reports |
| Bokeh | - Interactive visualization (suitable for large-scale data) - Supports streaming data updates - Embeddable web applications |
- Real-time data monitoring - Large-scale data set interaction - Web application development |
- High performance (suitable for big data) - Flexible interaction design |
- Documents are scattered - Default style is average |
| Pyecharts | - Interactive charts based on ECharts - Supports dynamic/3D/geographic maps - Embeddable Web/Jupyter |
- Chinese environment-friendly - Enterprise-level dashboard - Complex interaction requirements |
- Rich chart types (such as Sankey charts, calendar charts) - Flexible configuration - Complete Chinese documentation |
- Relies on JavaScript rendering - Non-pure Python ecology |
3. Use Function Call in RAG 🏄
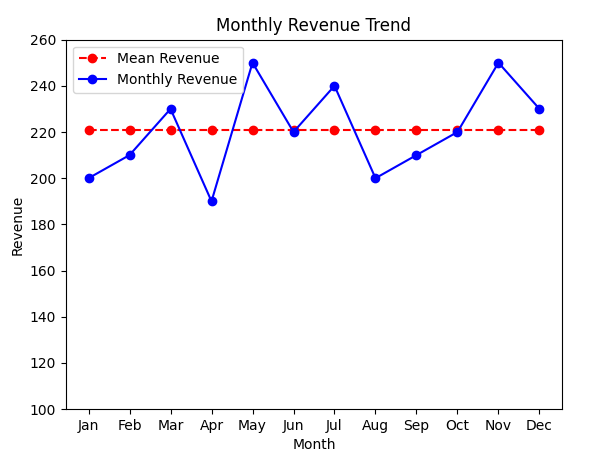
Here we use a simple example to explain how to implement numerical calculations through Function Call to improve the dynamic computing capabilities of the RAG system. Suppose we want to analyze a company's revenue data for the past 12 months. In the first step, through SQL transliteration and query, we obtained the revenue data for the past 12 months as follows:
| Month | 1 | 2 | 3 | 4 | 5 | 6 | 7 | 8 | 9 | 10 | 11 | 12 |
|---|---|---|---|---|---|---|---|---|---|---|---|---|
| Revenue (unit: 10,000 yuan) | 200 | 210 | 230 | 190 | 250 | 220 | 240 | 200 | 210 | 220 | 250 | 230 |
We can use prompt to instruct the large model, informing us that there is currently a mean calculation method that can understand the overall level within a period of time, and a function that calculates the variance can help understand the volatility of the data over a period of time. The smaller the variance, the smaller the volatility, and label the input parameter information corresponding to each function, as shown below (you can customize the function description format):
[{
"type": "function",
"function": {
"name": "get_mean",
"description": "Calculate the average of the input values to understand the overall level over a period of time",
"parameters": {
"type": "object",
"properties": {
"data": {"type": "list"}
}
}
}
},
{
"type": "function",
"function": {
"name": "get_variance",
"description": "Calculate data variance to understand the volatility of data within a period of time. The smaller the variance, the smaller the volatility.",
"parameters": {
"type": "object",
"properties": {
"data": {"type": "list"}
}
}
}
}]
When the large model receives these data and selects one of the analysis methods, it can call the corresponding function to calculate the mean (or variance) to further enrich the description of the statistical results. Mean variance is the most basic analysis method. You can also design some complex operators according to your needs to enhance your computing power.
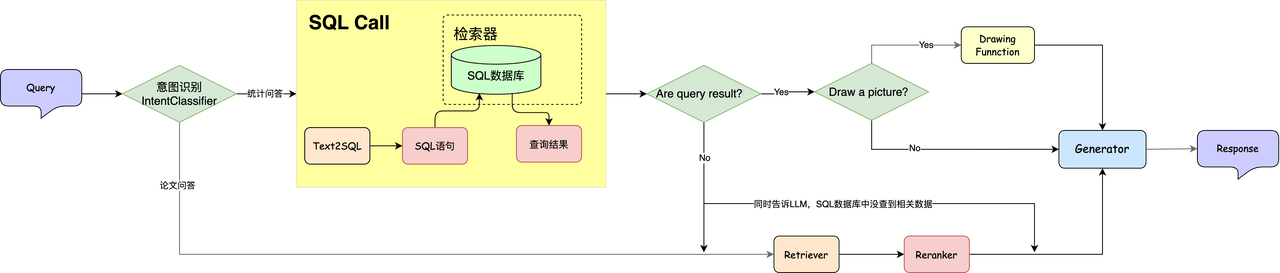
4. Draw charts 📉
Observing the above-mentioned December revenue table, we can find that this table is very suitable for drawing a line chart, which can more intuitively show users the revenue trend over the past 12 months. It is known that Function Call can call any external function, that is, the system can realize chart drawing, then we can implement a simple chart drawing program to draw line charts, pie charts, etc. for SQL query data, giving users more intuitive and clear answers. The overall idea is as follows:
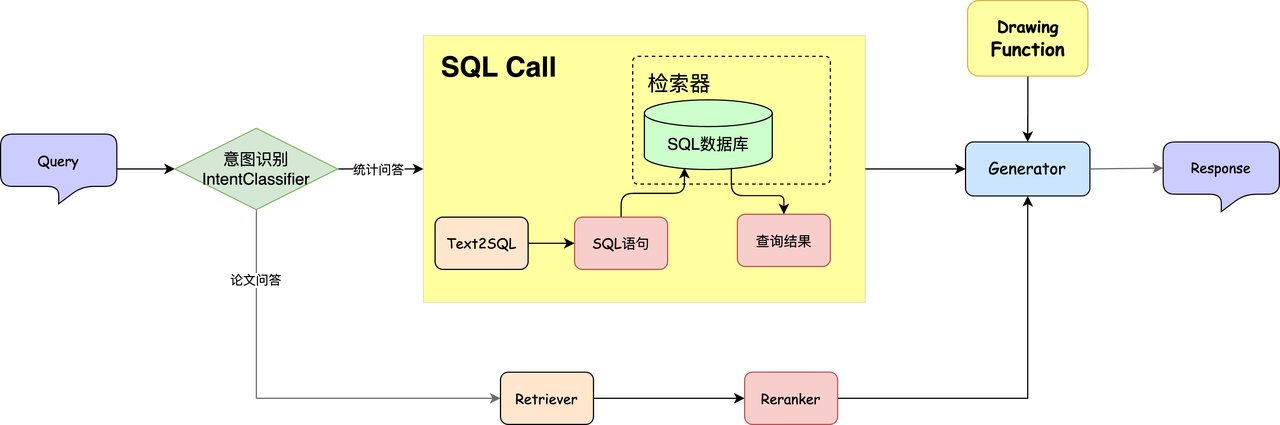
First, we propose a query, input it to the Text2SQL tool and convert it into a SQL statement, and then get the query results. The query results are sent to LLM, and the Drawing Function is pre-registered. In this way, LLM can combine the query results and drawing tools to draw the corresponding image. The output image format is as shown in the figure below. You can see that compared with pure text, the image format is clearer and clearer.
think
Can the large model directly output code, then execute the code and return the results?
Large model output code, executed in sandbox?
📊 The overall process is: after the user raises a question and passes the intent recognition, the system first uses the Text2SQL tool to convert the natural language into the corresponding SQL statement and executes the query; then the query results are handed over to the large language model (LLM) for processing, and through Code Interpret, the model can generate drawing code, and then execute the code in the sandbox to generate the corresponding chart. In this way, the system can achieve integrated output of data analysis and visualization.
Summarize
By integrating Text2SQL and FunctionCall, it can not only automatically generate query statements and perform complex data analysis, but also effectively improve the efficiency and accuracy of the analysis process. Among them, Text2SQL technology allows users to directly ask questions in natural language, and the system automatically converts them into SQL query statements. This greatly lowers the threshold for users to interact with the database, allowing users with non-technical backgrounds to query data through natural language. Function Call provides a mechanism to automatically execute tool calls, allowing the system to perform complex mathematical calculations or chart drawing on the extracted data, so that data analysis is not limited to extracting data, but can also perform in-depth analysis and reasoning, and can even compare and visualize different data sets to further gain insight into the trends and patterns behind the data.
By combining Text2SQL and FunctionCall, the RAG system can realize an integrated process from data acquisition to statistical analysis without manual intervention. In the practical class, we will implement the workflow shown in the figure above to implement a system that can answer both statistical questions and paper Q&A questions.